

You can have the best model in the world, but if your on-chain data is dirty, your results will still be garbage. Cleaning is where most of the real work happens, and in crypto it’s trickier than in “normal” datasets because blockchains are noisy by design.
Below is a practical, step‑by‑step guide focused on how to actually clean on-chain data so you can trust your metrics, dashboards, and models.
—
1. What “dirty” on-chain data really looks like
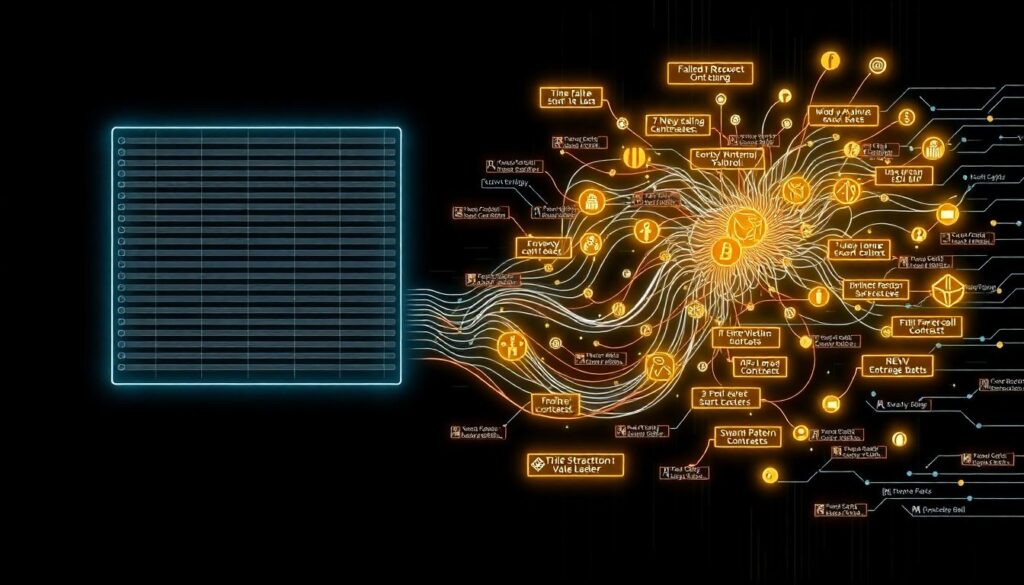
On paper, blockchains are perfect ledgers: every transaction is recorded, nothing is lost, everything is verifiable. In practice, the raw stream is full of quirks: failed transactions, internal calls, contract upgrades, proxy patterns, MEV bundles, bots, and mislabeled addresses. If you ingest this as‑is, you’ll miscount activity, users, and economic flows.
More importantly, “dirty” on-chain data isn’t just about missing values. It’s about subtle distortions: one real user spread across 20 addresses, fake volume from wash trading, or the same token contract living behind a proxy that your parser doesn’t understand.
—
2. Step 1: Start with the question, not the data
Before touching any code, write down what you’re trying to measure. On-chain data quality work is impossible if you don’t know what “correct” is supposed to look like for your use case.
Longer term, this step protects you from endless over‑engineering. You don’t need a full enterprise‑grade pipeline if your only goal is a quick funnel analysis for a single dApp.
Think in terms of concrete questions, for example:
– “How many *unique* users swapped token X in the last 30 days?”
– “What is the real daily volume of our protocol, net of failed and reverted calls?”
– “Which addresses are *likely* bots or internal system wallets we should exclude?”
Each question implies different cleaning rules. Counting users requires entity resolution; volume analysis needs careful handling of failed or partially‑executed transactions; bot detection needs anomaly handling.
> Tip for beginners: if you can’t express your goal in one or two clear questions, you’re not ready to design cleaning rules. Start there.
—
3. Step 2: Collect and normalize raw data
Once the questions are clear, you decide how to get the raw data. This is where you choose between running your own node, using third‑party APIs, or going through specialized providers and on-chain data analytics tools.
For most teams, especially early on, a hybrid approach makes sense:
– Public RPC or archive node for low‑level experimentation
– A hosted warehouse or API that already normalizes blocks, transactions, and logs
– Optional: specialized blockchain data cleaning services once your needs get serious
Normalization at this stage usually means:
You unify column names and data types (e.g., `block_timestamp` as UTC, `value` always in wei, transaction status as a boolean). You also decide which chains, which contracts, and which event signatures you care about. This early pruning reduces noise and speeds up everything else.
> Common mistake: mixing data from different providers without aligning schemas and timezones. That alone can silently break your metrics.
—
4. Step 3: Basic cleaning – types, ranges, duplicates
This is the boring but essential part: validating that the raw data structurally makes sense.
The exact implementation depends on your stack, but the checks are similar everywhere:
– Type checks: block numbers as integers, hashes as strings of correct length, numeric fields fat‑finger protected (no strings in numeric columns).
– Range checks: timestamps within blockchain lifetime, gas prices within plausible ranges, non‑negative token amounts (unless your model uses signed deltas).
– Uniqueness and duplicates: each transaction hash is unique per chain; if you see duplicates after joins, you investigate the join logic, not just `SELECT DISTINCT` everything.
Short but important warning: do not silently “fix” inconsistent values. Log them, flag them, and, when possible, trace them back to their source. Quiet fixes can hide upstream bugs for months.
For beginners, a simple validation layer can be enough:
– A daily job that scans the previous day’s data and counts invalid rows
– A report listing suspicious extremes (top 0.1% of gas prices, token transfers, etc.)
– Strict schema enforcement when loading into your warehouse
Over time, these transforms become part of your internal on-chain data quality solutions, not just ad‑hoc scripts.
—
5. Step 4: Entity resolution & address labeling
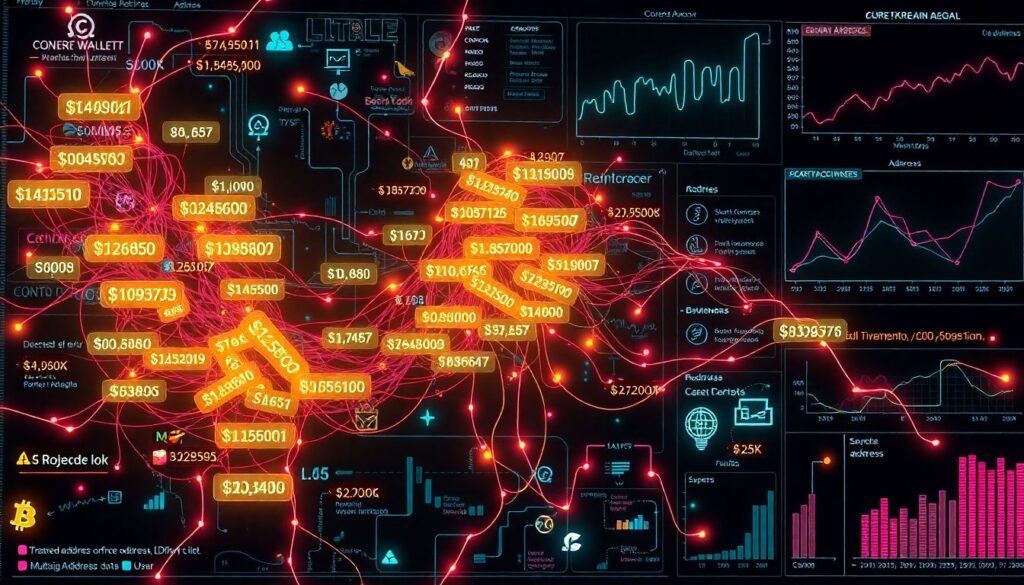
This is where blockchain data starts to resemble messy real‑world data. A single human or organization might control dozens or hundreds of addresses. On top of that, you have smart contracts, proxies, routers, and multisigs. If you treat all addresses as equal, your user metrics will be wildly off.
In practice, you want to:
Longer‑term, you’ll build heuristics and rely on external labels. Early on, it’s often better to lean on a crypto transaction data enrichment platform that already maps:
– Centralized exchanges and major custodians
– Known contract deployers and protocol addresses
– Bridges, routers, mixers, and MEV bots
Then you can add your own in‑house tiers: “team wallet,” “treasury,” “market maker,” “test account,” etc. Apply these labels consistently so you can filter them from user‑level analysis.
> Tip: start with exclusion lists. It’s usually easier to list addresses you *don’t* want in your metrics (exchanges, team wallets, testnets, faucets) than to perfectly identify every real user.
—
6. Step 5: Handling anomalies, bots, and protocol quirks
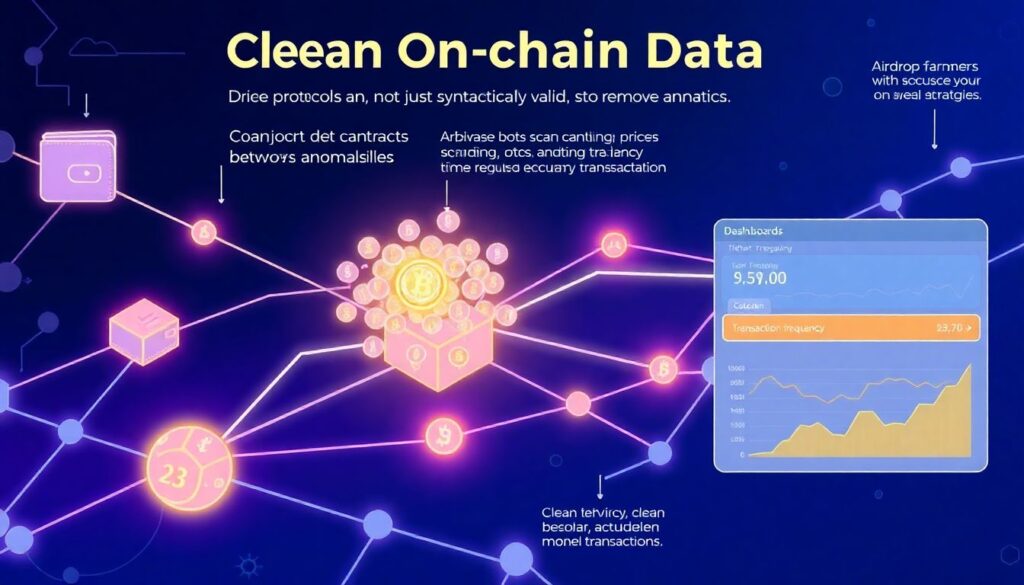
Clean on-chain data is not just syntactically valid; it also has anomalies understood or excluded. A few patterns to watch:
Many protocols are noisy by nature. Think airdrop farmers, arbitrage bots, automated strategies. To clean for *human* behavior, create filters based on:
– Transaction frequency and regularity
– Typical gas price behavior (bots often overpay systematically)
– Interactions with very specific MEV or arbitrage contracts
This is where on-chain data analytics tools are especially helpful: they allow you to iterate visually and spot patterns before you codify rules. Once you see a pattern, encode it in your cleaning pipeline as a persistent rule.
> Warning: over‑filtering is as dangerous as under‑filtering. Always keep a “raw vs cleaned” comparison to make sure your filters don’t erase real user activity.
—
7. Step 6: Compliance, monitoring, and automation
As soon as your on-chain analytics inform decisions—risk, trading, product, treasury—you need ongoing monitoring. Cleaning is not a one‑off task; new contracts, token standards, and attack patterns continuously appear.
In many teams, this is where more formal tooling enters the picture. You might adopt blockchain data compliance and monitoring software to detect sanctioned entities, suspicious flows, or regulatory red flags. At the same time, you can plug these insights into your own internal pipeline so that risky addresses are automatically tagged or filtered in your models and dashboards.
When your stack matures, it’s natural to blend multiple layers:
– Vendor‑grade blockchain data cleaning services for core accuracy and coverage
– Your in‑house transforms for product‑specific rules and edge cases
– Automated checks that alert you when key metrics suddenly diverge between raw and cleaned data
All of this becomes an integrated part of your broader on-chain data quality solutions rather than isolated scripts maintained by a single engineer.
—
8. A practical workflow for beginners
If you’re just starting out and don’t want to overcomplicate things, you can follow a lean workflow that still enforces solid habits.
First, pick a narrow use case (for example, tracking weekly active users for one protocol on one chain). Then:
– Phase 1 – Setup
– Choose a stable data source (API, warehouse, or provider)
– Define a minimal schema for blocks, transactions, logs, and addresses
– Implement basic validation: types, ranges, uniqueness
– Phase 2 – Filtering and labeling
– Exclude failed transactions and obvious spam
– Add simple labels: exchanges, known contracts, your own wallets
– Create a basic bot filter (extreme frequency, trivial patterns)
– Phase 3 – Iteration and monitoring
– Compare raw vs cleaned metrics regularly
– Log anomalies and adjust filters instead of patching data by hand
– Document every rule and the question it supports (“This rule exists because we want to measure *human* swaps, not MEV”)
This iterative process scales surprisingly far. As your use cases expand—more chains, more protocols, more compliance requirements—you can gradually plug in more advanced on-chain data analytics tools or even a managed crypto transaction data enrichment platform without throwing away your early work.
—
In the end, cleaning on-chain data is less about fancy algorithms and more about disciplined, repeatable rules tied to clear questions. If you define what you care about, validate structure, resolve entities, handle anomalies, and monitor your pipeline continuously, your analytics stop being “nice charts” and start becoming something your team can safely bet money and strategy on.