
Understanding Cross‑Chain Liquidity Risk
Why cross‑chain risk is a big deal
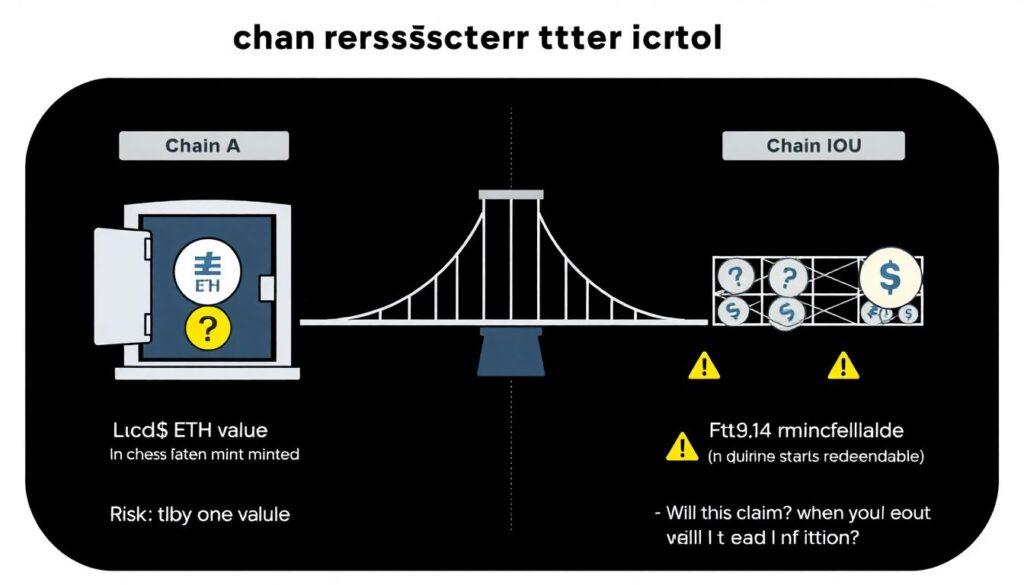
When you move assets across chains, you’re not really “sending ETH from chain A to chain B”. In most designs, you lock value on one side and mint a claim or IOU on the other. Your risk is not just “price goes down”, but “does this claim stay redeemable, and can I get out when I need to?” Evaluating cross‑chain liquidity risk means asking how likely it is that a bridge breaks, gets exploited, or simply runs out of exit liquidity right when everyone wants to leave. If you’re a fund, market maker, or protocol treasurer, a bridge failure can wipe out months of yield in a single bad weekend, so you want a systematic way to assess designs before you trust them with size.
Short version: if a bridge fails, you might be left with tokens that nobody wants and no real way back to the original chain. That’s the core risk you’re trying to quantify.
Where the risk actually comes from
The first source is technical: bugs in smart contracts, bad key management, or fragile consensus between chains. The second is liquidity structure: even if contracts are flawless, shallow pools and mercenary liquidity providers mean you can’t unwind large positions without huge slippage. Then there’s governance and operational risk: multisigs, upgrade keys, and oracles can be compromised or coerced. Finally, market structure matters; during stress, everyone runs the same way through the same narrow door. Good cross chain liquidity risk management solutions try to map all four buckets instead of staring only at audits or TVL. Treat bridges like leveraged counterparties: you care about their architecture, incentives, and how they behave under panic, not only during quiet, low‑volatility days.
Necessary Tools and Data Sources
On‑chain analytics and open dashboards
You don’t need a giant quant team to start; you do need data. Start with explorers and analytics platforms that show bridge inflows, outflows, and historical peak volumes. Check how often a bridge hits high utilization, how concentrated liquidity is across pools and LPs, and how deep the exit liquidity is on major DEXs and CEXs. A decent setup includes a block explorer per chain, an on‑chain analytics dashboard, and one or two price‑feed aggregators to track slippage for size. Many cross chain bridge security and liquidity provider service teams now publish public risk dashboards—things like validator uptime, message delays, and abnormal flows—so build the habit of reading these before you bridge. Even simple charts can reveal if you’re walking into a stampede or into an empty, illiquid corridor.
Institutional users will want alerts, not just dashboards. At minimum, set up notifications for unusual bridge delays, stuck messages, or rapid TVL drawdowns. Those are often the first visible symptoms before Twitter notices something is wrong.
Institutional‑grade tooling and specialized platforms
If you manage serious capital, institutional tools for evaluating cross chain liquidity risk become non‑optional. These tools aggregate contract audit data, bridge design classifications (custodial, MPC, light‑client, etc.), liquidity depth across chains, and even social‑signal indicators like governance drama and delayed bug disclosures. Some vendors pitch themselves as the best cross chain liquidity risk assessment platform; ignore the hype and evaluate them by coverage (how many bridges, chains, and tokens they track), latency (how fast they ingest new events), and interpretability (can you see why a score changed?). Ideally, their API plugs into your internal risk engine so portfolio managers see bridge risk next to position size and VaR. For smaller teams, even a lightweight SaaS with prebuilt alerts around bridges you actually use is already a big upgrade over flying blind.
Step‑by‑Step Process for Evaluating Risk
Step 1: Map the bridge design before touching it
Start by understanding how the bridge actually works, not just its marketing. Is it lock‑and‑mint, burn‑and‑mint, liquidity network, or message‑passing? Who or what confirms cross‑chain messages—multisig, MPC, external validators, light client, or native chain validators? How are upgrade permissions structured, and where are the keys physically held? A practical process is to diagram the full lifecycle of a transaction: deposit on chain A, state verification, message relay, minting or unlock on chain B, plus the reverse path. Mark every step where funds can be frozen or misrouted and every entity that can pause or upgrade contracts. Only once you see the full map do metrics like TVL, APY, or fee rebates mean anything. If your diagram is messy and opaque, that’s already a risk signal.
Then, read at least one independent security review or audit summary. You’re not trying to re‑audit the code; you want to know what classes of issues showed up previously and how fast they were patched. Slow response times or recurring critical findings are clear warnings.
Step 2: Quantitative liquidity and stress testing

Next, quantify how easily you can get in and out. Look at current pool sizes of the bridged asset on both chains across the main DEXs and CEXs you actually use. Simulate trades of realistic size and measure slippage in normal conditions. Then, run stress scenarios: assume a 30–50% drop in token price, plus a large outflow from the bridge. Would your exit size still clear with acceptable slippage, or do you hit a wall? Some cross chain liquidity risk management solutions and analytics platforms let you replay historical stress events—major hacks, chain halts—and see how specific bridges behaved. Use that: if a bridge froze, depegged, or saw its wrapped asset trade at a steep discount during previous crises, you know what to expect next time. Always align your position limit with the poorest liquidity side, not the prettiest chart.
If you lack tooling, you can approximate by manually sampling order books and AMM trades around volatile periods. It’s slower but still better than trusting TVL as a proxy for usable liquidity.
Step 3: Qualitative checks, governance, and insurance
Numbers don’t cover everything. Check how upgrades are proposed and approved, whether timelocks exist, and if emergency powers are clearly documented. Bridges that rely on opaque governance or off‑chain committees add another layer of trust you might not want. Also look for alignment between bridge operators and LPs: for example, whether fee structures reward patient liquidity, or mainly attract short‑term farmers. Finally, assess external protections. Some protocols integrate defi cross chain bridge insurance and risk coverage, either through on‑chain mutuals or off‑chain underwriters. Coverage is never perfect, but it can cap tail losses or at least offset operational downtime. Compare policies: what events are covered (exploit, depeg, validator failure), what triggers payouts, and who decides. A bridge with transparent governance, tested incident response, and partial coverage is arguably safer than a flashier but uninsured competitor.
If governance forums are dead or dominated by a tiny clique, treat that as a forward‑looking risk indicator. When things break, you’ll need fast, competent decision‑making.
Comparing Approaches to Risk Management
Custodial and centralized bridges
Centralized or custodial bridges feel familiar: a company or consortium holds assets, runs infrastructure, and issues wrapped tokens. From a risk point of view, this concentrates both security and liquidity management in one place. On the plus side, you often get professional operations, 24/7 monitoring, and direct support. A centralized operator can coordinate liquidity across venues and act as a market‑maker of last resort, which can be comforting for institutions. On the minus side, failure modes are binary: if custody or keys are compromised, everything breaks at once. You’re fully exposed to legal, regulatory, and jurisdictional shocks too. Compared to more decentralized designs, custodial bridges can look safer day‑to‑day but have nastier tail events, closer to a traditional exchange blow‑up than a gradual liquidity leak. Your evaluation should weigh that trade‑off explicitly.
Centralized providers sometimes bundle risk analytics and guarantees, but remember those guarantees are only as good as their own balance sheet and legal enforceability.
Trust‑minimized and light‑client bridges
Trust‑minimized bridges rely more on cryptography and consensus proofs than on human key‑holders. Think light clients, zk‑proofs, or direct verification of source‑chain state on the destination chain. Security here is “code plus economics” rather than “company plus custody”. From a security perspective, these designs can be superior because there’s no small multisig to compromise. But risk doesn’t vanish; it shifts into protocol complexity, proof systems, and often higher latency. Liquidity can also be more fragmented, since fewer centralized market makers are willing to operate across slow, complex rails. Evaluating them means digging deeper into assumptions: what must be broken for the bridge to misbehave, how likely are those assumptions to fail, and how quickly you can withdraw if the underlying chain itself has issues. For many users, these bridges offer a better long‑term safety profile but require more effort to understand.
You’ll also need to examine whether their ecosystem incentives are strong enough to attract stable liquidity, not just early airdrop hunters.
Liquidity networks and router‑based approaches
Liquidity networks and intent‑based routers don’t always lock and mint. Instead, liquidity providers front assets on the destination chain, then settle in the background later. That changes your liquidity risk profile. You’re less exposed to a single giant pool and more exposed to the behavior and solvency of participating LPs. Slippage and availability depend on LP competition, fee markets, and how routes are discovered. These systems can feel smoother in normal conditions because trades clear instantly, but they can seize up in unison if LPs pull inventory during volatility. Evaluating them requires looking at depth and diversity of LPs, default and slashing mechanisms, and whether there is any backstop or risk pool. Some networks integrate their own insurance modules, blurring the line between bridge and insurer. Compared to custodial and trust‑minimized bridges, they often offer better UX but more moving economic parts, which you must monitor over time, not just at onboarding.
For large tickets, always test with small probes across multiple routes to see how quotes and fills change under mild size pressure.
Troubleshooting and Ongoing Monitoring
Spotting red flags before something breaks
Even with a great setup, things go wrong. Common early warnings: withdrawals suddenly take much longer than documented; wrapped assets start trading at a discount relative to their underlying; or support and community channels go quiet exactly when users complain about delays. When you see these, reduce exposure immediately and investigate. Good practice is to compare multiple bridges for the same asset: if one route starts mispricing or stalling while others look fine, that’s a bridge‑specific issue. cross chain liquidity risk management solutions that include anomaly detection can help here, flagging deviations in message latency, validator participation, or TVL swings. If you lack fancy tools, manual heuristics—monitoring a few key metrics daily or weekly—are still effective. Have a playbook ready: size limits per bridge, conditions under which you pause new deposits, and how you communicate changes internally.
When in doubt, prioritize exiting over squeezing the last bit of yield. Treat bridge problems like exchange withdrawal issues: act quickly, not heroically.
Building a simple, repeatable playbook
Over time, aim to turn this into a routine rather than an art project. Decide which metrics matter most for your use case—liquidity depth, governance quality, technical design—and score each candidate bridge on a common template. Pick one or two providers as your primary routes and a couple of backups you’ve pre‑vetted. Some teams centralize this into a single dashboard, effectively their internal best cross chain liquidity risk assessment platform, combining analytics feeds, alerts, and qualitative notes. Others lean on vendors plus internal review. Whatever you choose, document it. Include how you react to major hacks in the broader ecosystem, when you rotate routes, and how you evaluate new bridges or updated versions. If you also use defi cross chain bridge insurance and risk coverage, wire its triggers and exclusions into the same checklist. The result is a clear, opinionated process that lets you move across chains confidently without pretending bridges are magically safe.