

Why missing data in on-chain analytics is normal (and fixable)
People often assume blockchains are “perfect datasets.” Every block is public, every transaction is immutable, so what could possibly be missing? Then you open a Dune dashboard or your own ETL pipeline and discover… half the story is gone:
addresses without labels, failed parses of logs, bridges that don’t reconcile, off-chain events nowhere to be found. Welcome to real-world on-chain analytics.
Missing data isn’t a bug in your skills; it’s a property of the ecosystem. Protocols upgrade ABIs, indexers time out, RPC nodes rate-limit you, and a ton of valuable information lives off-chain. The question isn’t “why is the data messy,” it’s how to handle missing data in on-chain analytics without fooling yourself or your stakeholders.
Let’s walk through the main approaches, compare them, and look at how people actually win with imperfect data instead of waiting for a magical “complete” dataset that never arrives.
—
Step 1: Admit the chain is incomplete (and map the gaps)
Types of missing data you’ll actually see
Before you can fix anything, you need to name it. In practice, on-chain gaps usually fall into a few buckets:
– Structural gaps:
– Historic blocks not fully indexed
– Partial parsing of logs or traces
– Inconsistent coverage across chains or L2s
– Semantic gaps:
– Unknown addresses (no labels, no entity mapping)
– Ambiguous events (same function signature, different meaning across protocols)
– No clear link between on-chain and off-chain entities (exchanges, custodians, market makers)
– Operational gaps:
– Node outages or RPC failures causing missing blocks
– ETL jobs that silently fail mid-range
– Schema changes that break parsers for a subset of protocols
Short version: the blocks are there, but the information isn’t.
The best blockchain analytics software for data gaps isn’t the one that “hides” them; it’s the one that makes these gaps visible so you can reason about them.
—
Step 2: Cleaning and preprocessing — the non-glamorous superpower
From raw chaos to something you can trust
Most people want to jump straight to charts and machine learning. The pros obsess over the boring middle part: how to clean and preprocess on-chain data for analysis so they don’t make pretty but wrong dashboards.
In practice, this means:
– Standardizing schemas across chains and protocols (e.g., a canonical “transfer” model instead of 20 event variations).
– Deduplicating events when indexers re-org or backfill data.
– Validating ranges: checking that each block height you claim to cover is actually present.
– Tagging uncertainty: explicitly marking rows as “partial,” “inferred,” or “source_missing” instead of pretending they’re equal.
This is the first “approach” to missing data:
> Don’t fill the gaps yet — quarantine them and make them explicit.
It’s less sexy than statistical imputation, but it gives you intellectual honesty. You can still build metrics, you just know where not to over-interpret.
—
Step 3: Leave gaps as-is vs. impute — two competing philosophies
Approach A: Strictness — never guess, only observe
One school of thought says: “If it’s not on-chain and verified, it doesn’t exist.” Under this approach:
– You never fabricate rows or inferred values.
– You might downsample time windows to periods with full coverage.
– You explicitly show “N/A” or confidence intervals where data is incomplete.
– You focus heavily on relative changes (trends) rather than absolute values.
This approach shines when:
– You’re doing risk, compliance, or security analytics where wrong positives are very expensive.
– You care about reproducibility and auditability.
– You want metrics to be defensible under external scrutiny.
Downside: you may systematically underestimate volumes, user counts, TVL, and you will often under-credit usage of protocols that route through unlabeled smart contracts.
—
Approach B: Imputation — carefully rebuilding the missing puzzle pieces
The other camp accepts that:
> In a live, adversarial, multi-chain environment you will never have a perfectly complete graph.
So they use data imputation solutions for blockchain and crypto analytics to approximate what’s missing, with clear disclaimers.
Common techniques include:
– Forward/backward filling for time-series when you know a value must be continuous (e.g., balances across blocks with a missing interval).
– Model-based inference of user entities by clustering address behavior, then extrapolating to unlabeled addresses.
– Probabilistic assignment of transfers to entities (e.g., which CEX deposit address cluster a new address likely belongs to).
– Cross-source reconciliation: mixing multiple indexers, explorers, and off-chain APIs to plug holes.
Upside: more complete, actionable metrics.
Risk: if you don’t track how you imputed, you can’t tell data-driven insight from data-driven illusion.
—
So which approach is better?
It depends on your use case:
– Risk, compliance, protocol security → lean toward strictness, minimal imputation, very explicit uncertainty.
– Growth, marketing, business intelligence → more aggressive imputation is acceptable, as long as assumptions are documented.
– Research, academia, public dashboards → often a hybrid: raw views + “interpreted” views side by side.
A good practice: always keep a “raw” layer and an “enriched/imputed” layer. Consumers can choose their risk/accuracy trade-off.
—
Step 4: Using enrichment instead of pure guessing
Why context beats blind statistics
You don’t have to rely solely on math. A crypto transaction analytics platform with data enrichment uses knowledge about protocols, DeFi primitives, and market structure to fill gaps semantically, not just numerically.
For example:
– If you know a contract is a Uniswap V2 pool, you can reconstruct trades from swap events even if a subset of logs fail to parse at first.
– If you know a bridge’s on-chain pattern, you can reconcile L1 lock events with L2 mint events, even with partial data on one side.
– If you know an address is an exchange hot wallet, you can reclassify thousands of downstream addresses as part of that entity’s ecosystem.
This is a more domain-driven approach to missing data: you leverage protocol knowledge, not just generic data science.
—
Inspiring examples: teams that turned missing data into an advantage
Example 1: A DeFi protocol that refused to fake TVL
One lending protocol I worked with had huge holes in historical logs due to early-indexer issues. The temptation was strong to “rebuild” TVL curves from partial snapshots.
Instead, they chose to:
– Publish two charts: “observed TVL” and “reconstructed TVL with caveats.”
– Mark the periods with unreliable coverage in red.
– Use the uncertainty as a talking point with investors:
“Here’s what we know with certainty, and here’s our best reconstruction.”
Ironically, that honesty helped them. VCs and partners trusted their dashboards more precisely because they didn’t hide missing data. They closed their round anyway — with a reputation for methodological rigor.
—
Example 2: Labeling gaps became the product moat
Another team built internal on-chain analytics tools for incomplete blockchain data and realized that nearly every competitor was focused on flashy interfaces, not data lineage.
They invested months into:
– Tracking which indexer each datapoint came from.
– Versioning parsers and ABIs.
– Storing explicit flags for “inferred_address,” “unlabeled_entity,” “estimated_value.”
At first, it felt like extra work. Later, that metadata let them:
– Offer confidence scores per metric to enterprise customers.
– Sell “audit-grade” analytics to funds and regulators.
– Differentiate themselves from dashboards that quietly changed historical numbers without explanation.
Their moat wasn’t more data; it was better-documented data.
—
Example 3: A cross-chain startup using gaps as a growth engine
A young startup noticed that many multi-chain dashboards struggled to align bridge flows and cross-chain TVL due to inconsistent indexing across L1s, L2s, and sidechains.
Instead of pretending they had full coverage, they:
– Published a “coverage matrix” per chain and protocol.
– Openly listed which bridges had missing or partial data.
– Invited power users and protocol teams to help patch specific gaps via PRs and community contributions.
Users loved this transparency and started contributing address labels, ABIs, and contract metadata. Missing data became a community on-ramp rather than a product embarrassment.
—
Comparing concrete techniques for handling missing on-chain data
1. Do nothing (but measure what’s missing)
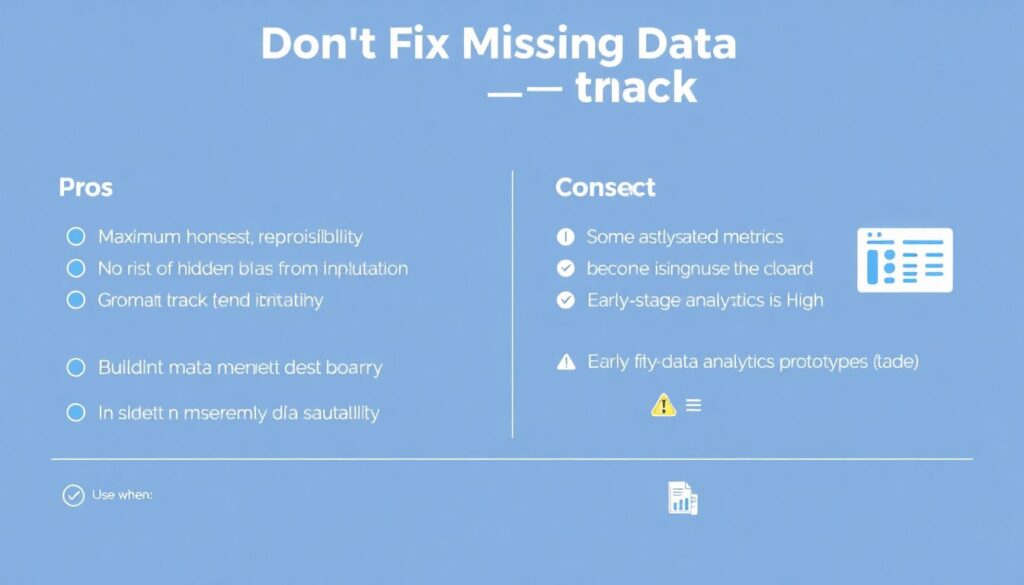
Idea: Don’t try to “fix” missing data; just track and surface it.
Pros:
– Maximum honesty and reproducibility.
– No risk of hidden bias from imputation.
Cons:
– Underestimated metrics.
– Some analyses become unusable when missingness is high.
Use when: building internal data quality dashboards, early-stage ETL, compliance contexts.
—
2. Rule-based extrapolation
Idea: Define explicit heuristics (rules) based on domain knowledge and apply them deterministically.
Examples:
– “If a balance is missing for block `N`, but we have it for `N-1` and there are no transfers/events, forward-fill the previous value.”
– “If transaction input matches a known router pattern, classify it as a DEX trade even if we lack a label for the intermediate contract.”
Pros:
– Transparent, explainable.
– Easier to reason about and test than black-box models.
Cons:
– Can be brittle when protocols change.
– Rules may not generalize across chains.
Use when: you have strong domain expertise and want explainable corrections.
—
3. Statistical and ML-based imputation
Idea: Use models to infer missing values, labels, or relationships.
Examples:
– Clustering addresses by transaction behavior to infer entities (CEX, DeFi fund, MEV bot).
– Time-series models to repair partial histories for volume/TVL.
– Graph models to guess missing edges in transaction networks.
Pros:
– Can recover useful structure from very noisy data.
– Scales to millions of addresses and interactions.
Cons:
– Harder to explain to stakeholders.
– Risk of overfitting and reinforcing biases.
– Requires careful evaluation with holdout sets and manual audits.
Use when: you need richer insights (e.g., user segmentation, advanced risk scoring) and can handle probabilistic outputs.
—
4. Cross-source fusion and reconciliation
Idea: Combine multiple data sources — your own indexers, public explorers, protocol subgraphs, custodial APIs — and reconcile discrepancies.
Pros:
– Often the most robust way to handle operational gaps.
– Lets you cross-check suspicious values.
Cons:
– More complex infrastructure.
– Requires strong identity and schema mapping to merge everything.
Use when: building production-grade analytics for funds, exchanges, or large protocols.
—
How to grow as an on-chain analyst living with imperfect data
Skills and habits that actually matter
If you want to get good at this, you don’t just need SQL and Python. You need a mindset:
– Skeptical curiosity: every metric is a hypothesis about reality, not a fact.
– Data lineage obsession: always ask “where did this come from” and “what’s missing.”
– Domain literacy: understand DeFi, NFT standards, L2 architectures, and bridge designs so you can spot impossible patterns.
On the practical side, refine skills in:
– Log and trace parsing across major chains.
– Building reproducible ETL pipelines.
– Implementing basic imputation and validation techniques.
– Communicating uncertainty clearly to non-technical stakeholders.
You’re not just an analyst; you’re a cartographer of an incomplete map.
—
Tools and resources to level up
What to use and where to learn

You don’t need to build everything from scratch, but you should understand what’s under the hood of your stack.
Look for on-chain platforms and libraries that:
– Expose raw and enriched layers instead of only giving you precomputed KPIs.
– Provide dataset documentation (schemas, coverage notes, version history).
– Allow you to export data so you can run your own checks and models.
Many teams now evaluate on-chain analytics tools for incomplete blockchain data not only by feature lists, but by:
– How they report indexing coverage and outages.
– How fast they fix parser issues when protocols upgrade.
– Whether they let you plug in custom enrichment or labeling pipelines.
To keep growing, combine:
– Hands-on practice: build your own dashboard from raw node data at least once.
– Reading protocol docs: learn ERC standards, AMM math, bridge mechanics.
– Academic / blog content: papers and deep dives on graph analytics, anomaly detection, and imputation methods.
—
Turning missing data from liability into leverage
Bringing it all together
Missing data in on-chain analytics isn’t going away. New chains launch, protocols upgrade, MEV patterns evolve, and off-chain components keep shifting. The winning teams don’t chase the fantasy of a perfectly complete dataset; they build workflows that embrace imperfection while staying honest about it.
If you:
– Make data gaps visible instead of hiding them,
– Choose your imputation strategy consciously (or consciously avoid it),
– Enrich data with domain knowledge, not just algorithms, and
– Communicate uncertainty as a feature, not a flaw,
you’ll be far ahead of most dashboards that quietly pretend all numbers are precise.
In that sense, the best blockchain analytics software for data gaps is less a product and more a philosophy: know what you know, know what you don’t, and be explicit about the gray area in between. That’s where the real insight — and your edge as an on-chain analyst — actually lives.