

Why “Raw” Crypto Data Is So Painful To Work With
Let’s be honest: crypto data in its raw form is a mess.
You pull trades from one exchange, balances from another, some on-chain info from a block explorer, maybe a few CSVs from a wallet — and suddenly your “simple” crypto report looks like a forensic investigation. Formats don’t match, timestamps are off, token symbols conflict, and nothing ties together.
Yet clients, bosses, and investors expect polished, publish‑ready crypto reports that look like they came from a million‑dollar analytics department.
This guide walks you through the *actual* path: from chaotic raw data to clean, defensible, ready‑to‑publish reports. With real cases, less obvious tricks, and workflows that don’t collapse the moment you add a new exchange or chain.
Step 1: Decide What “Good Enough” Looks Like
Before touching any file, answer a deceptively simple question:
Что должно быть в итоговом отчёте и для кого он?
For a private investor, “good enough” might be:
– PnL by token and by month
– Realized vs unrealized gains
– Basic tax‑ready exports
For an institutional‑grade crypto market research report services workflow, you’re talking about:
– Methodology section (data sources, filters, assumptions)
– Time‑series consistency across multiple chains and venues
– Reproducibility: someone else can re‑run your pipeline and get the same charts
The trick: lock this down *first*. Any data you don’t need to answer your core questions is a distraction for this iteration. Archive it, don’t process it.
Step 2: Taming the Raw Data Flood
Different sources, different headaches. Let’s break it down.
Centralized Exchanges: The Illusion of Structure
You’d think CEX exports are plug‑and‑play. Not quite.
Typical issues:
– Different time zones
– Inconsistent fee columns
– Symbols that don’t match on other venues
– Partial fills that must be aggregated
Real case:
A prop‑desk analyst tried to reconcile PnL across three exchanges. Numbers were always “off by a bit.” Root cause? One exchange exported timestamps in local time with daylight savings, another in UTC, and the third with millisecond precision but no timezone. Once they normalized all timestamps to UTC *first*, 90% of the reconciliation headache disappeared.
Pro tip:
Normalize at ingestion:
– Convert timestamps to ISO 8601 UTC right away
– Map symbols to canonical IDs (e.g., use CoinGecko/CMID style ids internally)
– Store raw and normalized forms; never overwrite original data
On‑Chain Data: Precision With Hidden Landmines
On‑chain data feels pure: it’s all on the ledger. Reality: the complexity moved from storage to interpretation.
You’ll face:
– Smart contracts with custom logic (rebasing tokens, fee‑on‑transfer, wrapped assets)
– Internal transactions vs external ones
– Events that need decoding just to know what happened
This is where on-chain analytics tools for crypto reporting earn their keep. They handle:
– ABI decoding for common protocols
– Labeling addresses (exchanges, bridges, MEV bots, whales)
– Deriving metrics like TVL, DEX volume, unique active wallets
Non‑obvious solution:
Don’t try to understand every contract. Start by white‑listing what you *do* trust (major DEXes, lending protocols, bridges) and ignore the rest in version 1 of your report. Document this as a limitation instead of silently guessing.
Step 3: Build a Minimal, Repeatable Pipeline
You don’t need a full‑blown crypto data analytics platform on day one. But you do need repeatability. Otherwise every monthly report becomes a fresh nightmare.
At a minimum, your pipeline should have:
– Ingestion
– Pull data from exchanges, wallets, custodians, on‑chain sources
– Save raw dumps unchanged
– Normalization
– Standardize timestamps, symbols, decimal precision
– Map addresses to entities when known
– Business logic
– Classify transactions (trade, transfer, fee, reward, airdrop, staking)
– Tag special flows (bridge in/out, internal transfers between own wallets)
– Output layer
– Aggregated tables / views
– Charts and narrative sections for the final report
Start simple. You can implement this with:
– Python + Pandas + scheduled scripts
– A cloud warehouse (BigQuery, Snowflake, PostgreSQL) and SQL transforms
– Or light‑weight automated crypto reporting software for investors if your team is non‑technical and needs something visual
What matters most: version control for logic. You want to know *which* code and *which mapping rules* produced a given report.
Step 4: Clever Ways To Reduce Manual Work
Manual classification is where projects go to die. Here’s how to sidestep that.
1. Use Patterns, Not Just Labels
Instead of manually tagging each transaction, create pattern‑based rules:
– All transfers from your hot wallet to exchange deposit addresses → “Deposit to CEX”
– Repeated small inflows from mining pools → “Mining rewards”
– Interactions with a specific staking contract → “Staking in/out”
You can implement this with:
– SQL CASE expressions
– A simple rules engine in Python
– Or tagging features in your analytics / portfolio tool
2. Let Heuristics Do 80% of the Job
You don’t need machine learning to get big wins.
Examples of lightweight heuristics:
– If two addresses trade only with each other and share IP/label data → likely internal wallets
– If a token is only ever sent to/from a DEX pair and never held → treat it as a routing/LP position, not “portfolio exposure”
– Transactions with 0 value on L2 but high calldata → often just state sync/bridging, not economic transfers
Document these heuristics in the methodology of your crypto report so reviewers trust your output.
Step 5: Making It Institutional‑Grade
When you’re building for funds, family offices, or a cryptocurrency data provider for institutional investors audience, “it looks right” isn’t enough. You need traceability and auditability.
What Institutional Readers Expect
– Clear data lineage: where each metric came from
– Ability to re‑run the report on a different date and get consistent numbers (given same inputs)
– Transparent treatment of edge cases (airdrops, forks, rebases, NFT collateral, etc.)
This is where many teams secretly hit a wall: they have a nice dashboard but no documented process.
Non‑Obvious Institutional Trick: Dual‑Layer Reporting
Run two layers of reporting:
1. Operational layer
– High‑frequency, near real‑time dashboards
– Useful for traders and risk teams
– Can include some approximations
2. Official (publish‑ready) layer
– Snapshot‑based, locked datasets for each period
– Every metric is generated from a tagged, immutable dataset
– Any corrections are logged as adjustments, not silent overwrites
This dual‑layer approach keeps traders happy without compromising the integrity of the official monthly or quarterly report.
Step 6: Alternative Methods When You Can’t Build Everything
Not every team can assemble a full data engineering squad. That’s fine. You have options.
Option A: Off‑The‑Shelf Platforms
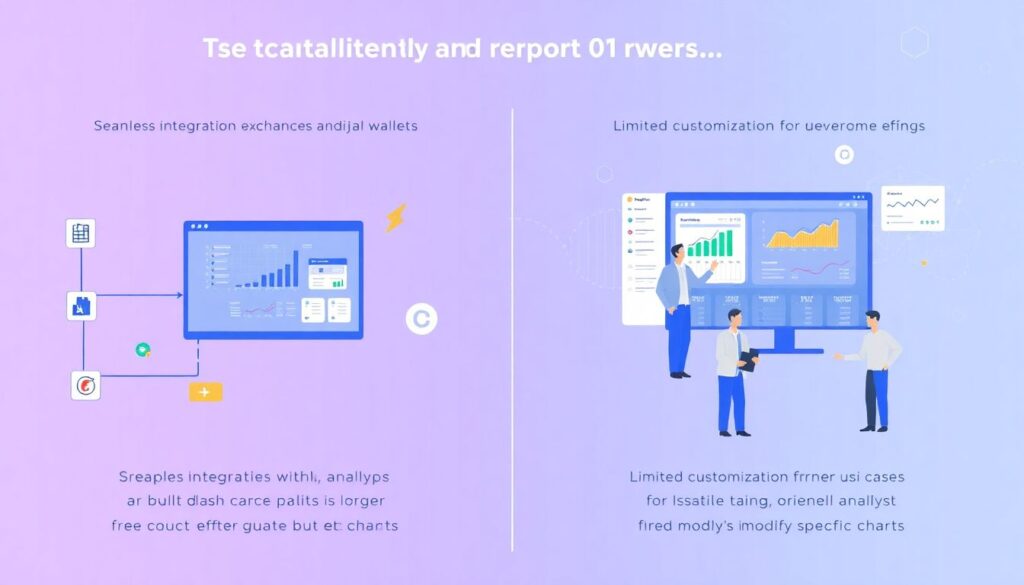
Using an established crypto data analytics platform is usually the fastest way to ship version 1 of your report.
Advantages:
– Integrations with popular exchanges and wallets
– Pre‑built dashboards and attribution models
– Lower engineering overhead
Downsides:
– Limited customization for niche use‑cases
– Vendor lock‑in if you don’t own the underlying data models
Option B: Hybrid Stack
You can mix:
– A vendor solution for ingestion + basic normalization
– Your own warehouse and business logic on top
This “best of both worlds” setup works especially well if:
– You need custom KPIs
– You want to publish research externally
– You must comply with internal data retention/governance rules
Option C: DIY With Open Data
If budgets are tight, leverage:
– Free node APIs (within reason)
– Open Dune queries / Flipside data as inspiration
– Public GitHub repos for common on‑chain metrics
Caveat: this is great for *experimentation* and prototyping, but be careful relying 100% on open endpoints for institutional reporting. Rate‑limits and schema changes can break your pipeline overnight.
Step 7: Turning Metrics Into a Story
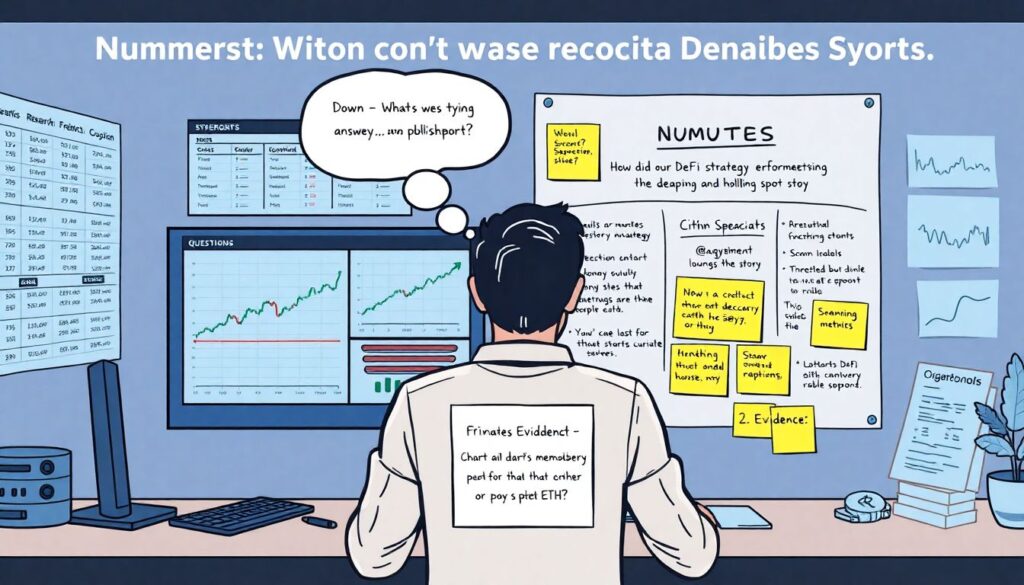
Numbers alone don’t make a publish‑ready crypto report. People remember stories, not spreadsheets.
Think in this order:
1. Question – What are we trying to answer? (e.g., “How did our DeFi strategy perform vs holding spot ETH?”)
2. Evidence – Which metrics and charts support or contradict the narrative?
3. Context – Market events, regulatory shifts, protocol changes during the period
4. Implications – So what? What should we do differently?
Narrative‑First Reporting Hack
Before building charts, draft a one‑page outline of the story:
– Opening: what changed during the period
– Body: key drivers of performance, risk, and flows
– Closing: lessons, decisions, next steps
Only after that, ask: *“Which datasets and visuals do I need to tell this story convincingly?”* This prevents the classic “pretty dashboard, zero insight” problem.
Step 8: Automate the Boring, Review the Critical
Automation is your friend — up to a point.
Automate:
– Data pulls and ingestion
– Basic normalization and mapping
– Recurring charts and tables
– File generation (PDF, HTML, slide exports)
Keep human review for:
– Outliers and unexpected spikes
– Methodological changes
– New protocols, tokens, or data sources
For many teams, the sweet spot is using automated crypto reporting software for investors plus a short, structured review checklist before anything goes out the door.
Quick Review Checklist (Stealable)
Before you publish, verify:
– Time coverage: start/end dates match what you state in the title
– Totals: portfolio value and PnL reconcile with custodians / internal accounting
– Methodology: all assumptions and known gaps documented
– Comparability: major KPIs can be compared to previous periods without caveats
Step 9: 5 Pro‑Level Tricks That Save Hours
Here are compact, battle‑tested hacks professionals quietly rely on:
– Standardize currency early
Convert everything to a reporting currency (e.g., USD or EUR) at a consistent rate source. Store native units separately; don’t overwrite them.
– Snapshot balances at fixed cut‑offs
For monthly reports, always use the same cut‑off time (e.g., last calendar day, 23:59:59 UTC). This removes endless micro‑discrepancies.
– Tag “unknowns” explicitly
Don’t leave mysterious flows uncategorized. Use tags like “UNCLASSIFIED_DEFI_FLOW” so you can revisit them later and track their share over time.
– Keep a data dictionary
Define what each metric means: “Net Flow,” “Realized PnL,” “TVL,” “Staked Assets.” This avoids internal disputes and external confusion.
– Version your logic, not just your code
When you change how, say, staking rewards are calculated, bump a “reporting schema version” and note it in the PDF or slide deck.
Bringing It All Together: From Chaos to Confidence
Going from raw crypto data to publish‑ready reports isn’t about one magic tool. It’s about a chain of disciplined decisions:
– Decide what “good enough” looks like for your audience
– Normalize and structure data with repeatable rules
– Use tools and platforms where it makes sense, but keep control of methodology
– Separate operational dashboards from official, publish‑ready outputs
– Wrap data in a clear, honest narrative with documented assumptions
If you build even a lean version of this pipeline, your reports stop being a monthly fire drill and start feeling like a reliable product you can stand behind — whether you’re serving a single high‑net‑worth client or producing full‑scale crypto market research report services for a global audience.