
Why staking metrics matter way more than the APY banner
If you pick staking assets purely by “highest APY” on a dashboard, you’re basically buying a car by only checking the top speed. It might be fun for a week—and then the engine falls off.
staking metrics for crypto investment decisions are your risk radar. They tell you:
– How likely you are to actually receive those shiny rewards
– Whether the tokenomics are sustainable
– How fast you can exit if sentiment flips
Let’s walk through how to interpret staking metrics for asset selection in a way you can actually use in practice, not just quote on Twitter.
—
APY: when a big number is actually a red flag
The first thing everyone looks at is APY. That’s fine—but you need to know what sits behind it.
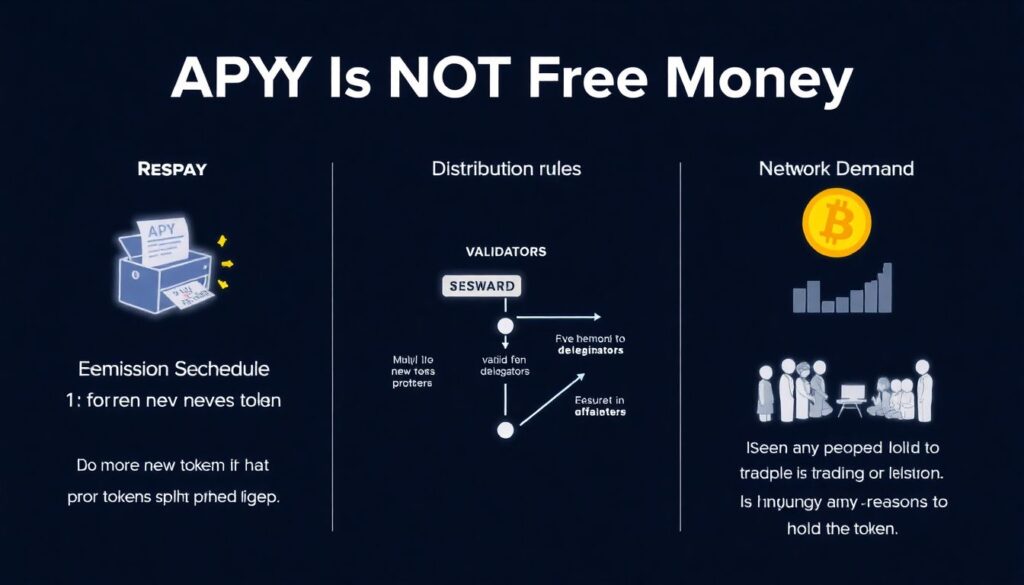
Short version: APY is *not* free money. It’s:
– Emission schedule (how many new tokens are printed)
– Distribution rules (validators vs delegators vs treasury)
– Network demand (is there any reason to hold or spend this token?)
If you see 200–400% APY on a small-cap chain, that often means:
– Massive token inflation
– No real demand yet
– Early-stage bootstrapping, high risk of “reward now, dump later”
By contrast, large caps like Ethereum, Solana, or Cardano more often sit somewhere in the ~3–8% range for staking, sometimes 10%+ with extra protocol incentives.
Now, the real question: how to choose staking coins by apy and risk?
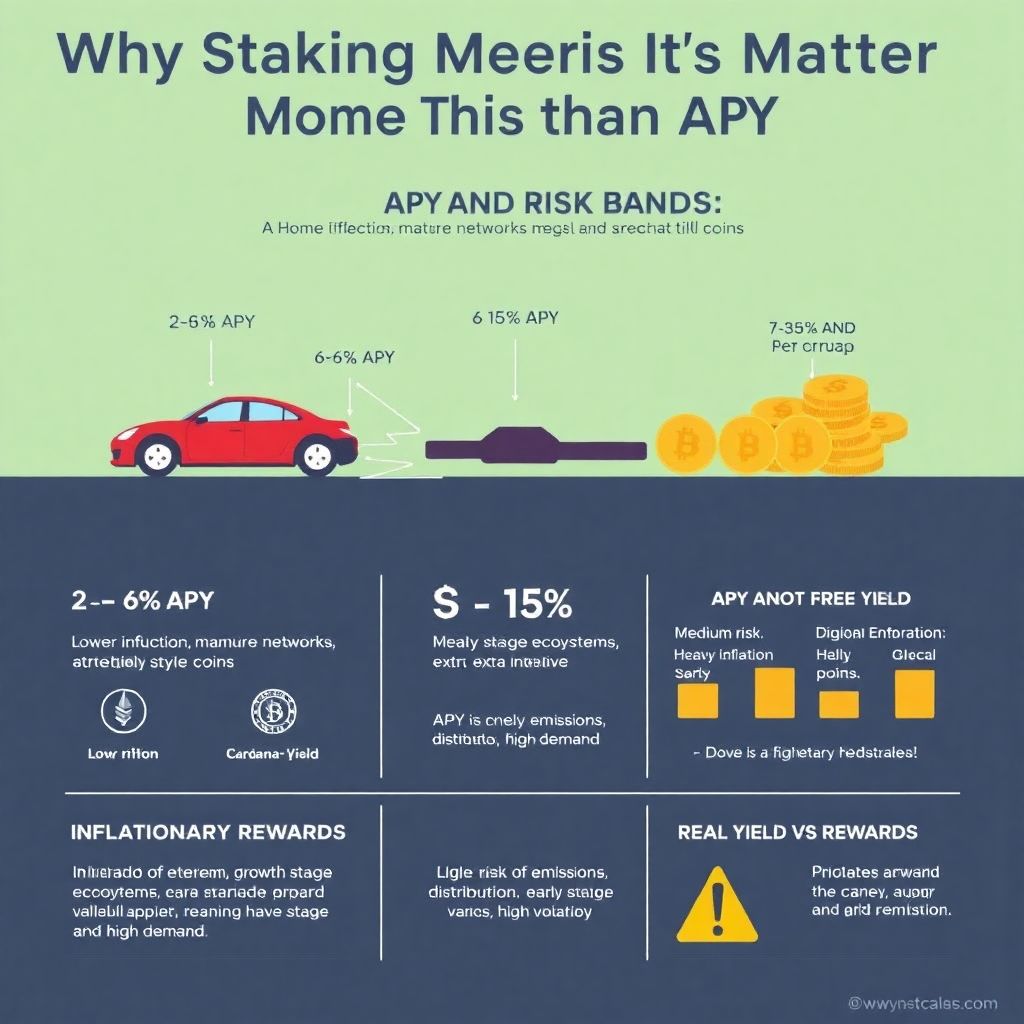
Think in bands, not just single numbers:
– 2–6% APY: Usually lower inflation, more mature networks, lower but steadier yield
– 6–15% APY: Medium risk, often growth-stage ecosystems or extra incentives
– 15%+ APY: High risk, often early-stage or heavily subsidized, expect token price volatility
If the APY is high *and* the token emissions are permanently high (check docs / tokenomics), you’re often just being paid to hold a depreciating asset.
—
Technical note: Real yield vs printed yield
When you look at APY, split it in your head into two buckets:
1. Protocol / inflationary rewards
– New tokens minted every block or epoch
– Dilutes existing holders
– If no demand grows, token price tends to trend down over time
2. Real yield
– Paid from actual economic activity: fees, MEV, liquidations, etc.
– Ethereum after the Merge is the classic example: part of validator rewards comes from priority fees + MEV, not just new ETH issuance.
If 100% of the APY comes from new tokens, ask yourself:
> “Would I still want this if price drops 40% while I’m earning 25% APY?”
If the answer is no, it’s speculation, not passive income.
—
Staking ratio and network concentration: who really secures the chain?
One of the more underrated staking metrics for crypto investment decisions is the staking ratio—the percentage of total circulating supply that’s staked.
Rough guidelines:
– Very low ratio (e.g., 10–25% staked):
– Network may be less secure
– But also means less dilution of *non*-stakers, so APY might be lower or emission lower
– Could indicate lack of trust or poorly designed staking UX
– Moderate ratio (30–60%):
– Common for many PoS networks
– Healthy mix of liquidity and security
– Very high ratio (70%+):
– Cosmos-style chains often sit here
– Great for security
– But if too much is locked, sell pressure can build once unlocks or unbonding periods end
You should also look at validator concentration:
– How much stake sits in the top 10 validators?
– Are there exchange validators with dominant share?
– Is there a risk that governance is basically controlled by a handful of entities?
If 60–70% of the stake is controlled by a few players, that’s a centralization risk, even if APY looks juicy.
—
Technical block: Comparing ETH, SOL, and a small-cap chain
Imagine three options:
– ETH liquid staking: 3.5–4.5% effective yield
– SOL staking: ~7–8% APY depending on validator and commission
– New chain “XYZ” with 120% APY
Key differences under the hood:
– ETH:
– Real yield from fees + MEV
– Huge liquidity and deep derivatives markets (LSTs, money markets)
– Strong security assumptions
– SOL:
– Mix of inflationary rewards and fees
– High throughput, increasing real fee component as ecosystem grows
– Active DeFi, good secondary yield options
– XYZ:
– Almost purely inflation
– Little to no fee volume
– Reward stream collapses if new buyers disappear
If your goal is best crypto assets for staking passive income, the sustainable answer tends to lie with ETH/SOL-type networks with real usage, not lottery-style emissions.
—
Reward frequency and compounding: small details, big impact
Two chains can show the same APY, but your real return differs based on payout frequency and auto-compounding.
Key points to check:
– How often are rewards distributed? (per block, daily, per epoch)
– Do you need to manually claim, or does the validator auto-compound?
– Are there claim fees or gas costs that eat into returns?
Example from practice:
– Chain A: 10% APY, rewards every block, automatic compounding via a liquid staking token
– Chain B: 10% APY, rewards need to be manually claimed and restaked every week, gas per claim = $2
If you only restake occasionally on Chain B, your real APY might drop closer to 7–8%, while Chain A stays near theoretical 10%.
For someone running a medium five-figure portfolio, that gap can be hundreds of dollars per year, just due to compounding structure.
—
Lockup periods and unbonding: the hidden risk lever
A huge part of any guide to evaluating staking rewards and lockup periods is understanding what happens when you want to *exit*.
Typical models:
– No lockup / instant unstake (often via liquid staking derivatives)
– Fixed lockup (e.g., 7, 14, 21, or even 180 days)
– Flexible with unbonding delay (common in Cosmos, Polkadot-style chains)
Questions to ask before staking:
– What is the unbonding period?
– Can the rules change via governance?
– Are there liquid staking solutions that let you exit faster (by selling a staking derivative)?
Real-world example:
– Cosmos Hub (ATOM): 21-day unbonding period
– Polkadot: 28-day unbonding
– Many L1s: 2–14 days
If you stake an asset with a 21–28 day unbonding period and the market nukes 40% in a week, you are locked watching the drawdown. High APY doesn’t compensate if you can’t manage downside.
—
Slashing risk and validator quality
Another critical metric: slashing parameters and historical validator performance.
Things to check:
– Double-signing penalty (how much stake can be slashed in catastrophic events)
– Downtime penalty (for being offline)
– Has your chosen validator ever been slashed?
– What’s their uptime over the last 90–180 days?
In practice, slashing events are rare on major networks, but they do happen. On some chains, a severe double-signing slash might take 5–10% of your delegated stake instantly.
Trade-off:
– Higher commission but long history, professional operator, high uptime
– Low-commission unknown validator with weaker infra
Sometimes paying a 5–10% commission to a reputable validator is cheaper than gambling on someone who might cost you 5–10% of principal in a slash.
—
Technical digression: How validator commission really affects you
People often overreact to small differences in validator commission rates.
Example:
– Validator A: 5% commission, 8% gross APY
– Validator B: 10% commission, 8% gross APY
Your effective APY:
– A: 8% × (1 − 0.05) = 7.6%
– B: 8% × (1 − 0.10) = 7.2%
On $10,000, that’s a $40/year difference.
If Validator B has significantly better uptime, better tooling, and lower operational risk, that 0.4% difference is often irrelevant compared to the cost of missed rewards or a rare but painful slash on a weaker validator.
—
Using staking analytics tools to compare assets properly
Raw APY on a single dashboard won’t cut it. You need staking analytics tools to compare crypto yields across multiple chains and adjust for risk.
What to look for in these tools:
– Display of nominal APY vs adjusted for inflation
– Historical APY chart (not just today’s number)
– Staking ratio, validator concentration, and slashing history
– Realized yields over time for different validators or strategies
When you compare:
– ETH 4% APY with low inflation and strong fee burn
– A small-cap with 60% APY and 30–40%+ annual token inflation
The inflation-adjusted picture is very different. Real yield might actually be *negative* if price bleeds faster than rewards accumulate.
—
Checklist: How to interpret staking metrics for asset selection
When you’re actually clicking “stake” with real money, walk through a quick checklist:
– Token fundamentals
– Is there real usage (fees, DeFi, NFTs, infra)?
– Is staking mandatory for security or just a marketing “earn” feature?
– Reward structure
– Nominal APY and its volatility over last 3–6 months
– How much of APY is inflation vs real fees?
– Reward frequency and compounding method
– Lockups and liquidity
– Unbonding period in days
– Availability and liquidity of liquid staking tokens (can you exit via DEX/CEX?)
– Any scheduled big unlocks or vesting cliffs that could add sell pressure
– Validator and network risk
– Slashing parameters and past slashing events
– Validator commission vs uptime and reputation
– Staking ratio and stake centralization
Once you overlay all of that, it becomes much clearer how to choose staking coins by apy and risk instead of just chasing the top number on the list.
—
Practical portfolio example: Putting it all together
Let’s say you have $20,000 you want to allocate to staking-based strategies for passive yield.
You might build something like:
– 40–50% in majors (ETH, SOL)
– via reputable liquid staking platforms
– targeting 4–7% sustainable yield
– 30–40% in mid-cap L1 / L2 with real ecosystem activity
– APY 8–15%, but you’ve verified:
– lockups are reasonable
– decent fee volume
– reasonable decentralization
– 10–20% in higher-risk, high-APY experiments
– Smaller caps with >20% APY
– You size this portion assuming potential large drawdowns
Using this structured approach, your blended APY might sit around 7–12%, but importantly:
– Major portion in assets with proven track record
– Only a small, controlled slice chasing outsized yield
This is how people who care about capital preservation think about best crypto assets for staking passive income—not “which farm shows the biggest number today,” but “which stack of assets and metrics gives the best risk-adjusted yield over years, not days.”
—
Final thoughts: build a repeatable staking process
If you treat every new staking opportunity as a fresh research nightmare, you’ll burn out. Turn it into a simple, repeatable process:
– Step 1: Screen assets using a few trusted dashboards
– Step 2: Check APY history, inflation, and fee share
– Step 3: Inspect lockups, unbonding, and liquidity options
– Step 4: Evaluate validator or protocol risk (slashing, security incidents)
– Step 5: Decide position size based on risk band (core, growth, speculative)
Do this a few times and you’ll start to recognize patterns quickly—what’s sustainable, what’s a marketing stunt, and where the real long-term yield lives.