

Designing AI‑assisted dashboards for crypto risk in 2025 is less about shiny charts and more about survival. Markets move faster, regulators are finally awake, and “eyeballing volatility” in a spreadsheet is a good way to blow up a fund.
Below — a structured, practical walkthrough of how to design these systems so they’re actually usable, auditable, and worth the engineering budget.
—
Why AI‑assisted crypto risk dashboards suddenly matter
The last few years turned risk from a side‑panel to the main screen. We’ve seen:
– Multiple centralized exchange failures
– De‑pegs of stablecoins
– Sharp regulatory moves in the US, EU and Asia
– On‑chain exploits that drained hundreds of millions in minutes
By 2024, institutional crypto AUM was commonly estimated in the hundreds of billions of dollars globally, and derivatives volumes on major exchanges routinely surpassed spot volumes. That means leverage and liquidation cascades are not edge cases — they’re the baseline environment.
In this context, an AI‑assisted crypto risk management dashboard is no longer a “nice‑to‑have visualization.” It’s a control panel for exposure, liquidity, and counterparty risk — and it has to work in real time.
—
Core design principles for AI‑assisted crypto risk dashboards
1. Start from real user workflows, not from AI features
Before picking models or datasets, pin down who is going to live in this dashboard:
– Quant fund risk managers
– Centralized exchange (CEX) risk teams
– DeFi protocol contributors
– Compliance and treasury at corporates holding crypto
Each group has different questions:
– “What’s my liquidation risk in the next hour if BTC drops 5%?”
– “Which wallets or counterparties look like they’re engaging in sanctioned behavior?”
– “How would a new margin rule have changed yesterday’s PnL distribution?”
If you skip these questions and jump straight to “let’s add an anomaly detector,” you’ll ship a pretty but useless interface.
So design flow first: What’s the morning risk check? What’s the crisis mode? What gets exported to regulators or LPs? The AI comes in to speed up and sharpen those flows, not to replace them.
—
2. Blend AI with classic quant risk — don’t throw VaR out the window
A good AI‑assisted dashboard doesn’t ignore traditional metrics. It layers machine learning on top of a solid quant foundation.
Longer‑form view:
– Classical layer: Value at Risk (VaR), Expected Shortfall, volatility, drawdowns, margin utilization, collateral ratios, liquidity depth. These are still the lingua franca for boards and regulators.
– AI layer: Pattern detection, scenario generation, anomaly scoring, non‑linear relationships between assets, early‑warning indicators from order books, news, and on‑chain behavior.
For example, instead of just plotting 1‑day 99% VaR for each token, an AI model can flag “VaR blind spots” — situations where historical data underestimates risk because of regime shifts (e.g., new perp listing, big unlock event, or fresh regulatory announcement).
The crypto community loves to declare old models “dead,” but in practice the winning dashboards in 2025 are hybrids: durable math plus adaptive AI.
—
3. Make explainability a first‑class citizen
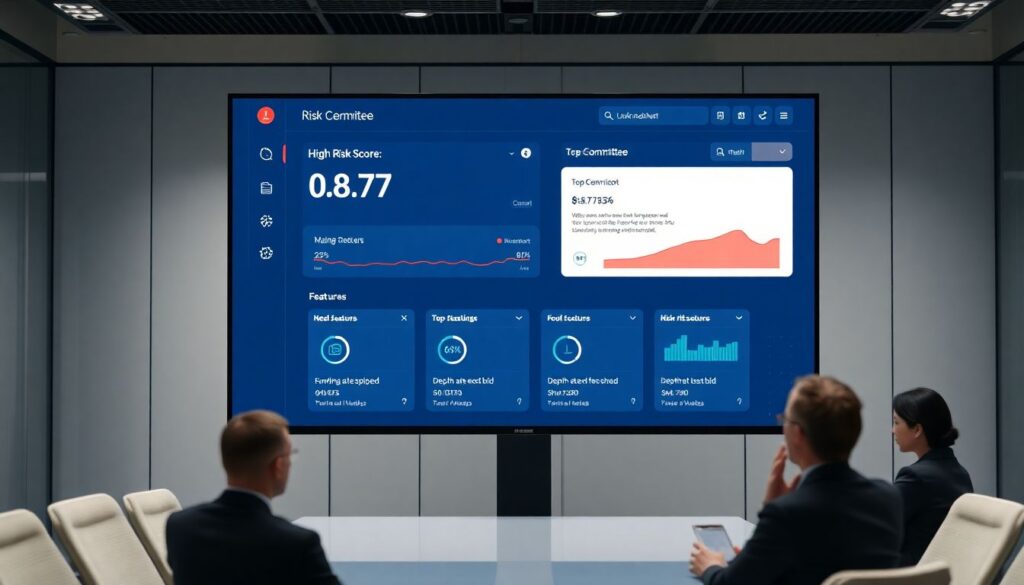
If the dashboard simply says “High risk score: 0.87” with no context, your risk committee will either ignore it or panic at random.
Shorter point: every AI output needs a “why.”
For each AI‑generated alert, add:
– Top contributing features (e.g., “Funding rates spiked +0.012%, depth at best bid shrank 40%”)
– Historical context (“We’ve seen similar patterns 14 times in 3 years; 9 led to >10% intraday sell‑offs”)
– Confidence bands (“Model stable; recent backtest error within normal range”)
Technically this means building explainability (SHAP values, feature importance, counterfactual examples) into the visualization layer itself, not buried in a research notebook.
—
Data foundations: the unsexy part that makes everything work
4. Combine off‑chain, on‑chain and alternative data
An effective cryptocurrency risk analytics platform in 2025 pulls data from several families:
Longer paragraph:
– Market microstructure: Order books, trades, funding rates, open interest, liquidations from CEXs and DEXs.
– On‑chain analytics: Token transfers, DEX volume, liquidity pool health, staking flows, bridge activity.
– Counterparty meta‑data: KYC tiers (where allowed), credit limits, historical default/late payment, smart contract audits.
– News and sentiment: Headlines, social media spikes, governance forum discussions, GitHub activity.
AI models excel when they triangulate across these sources. For instance, a spike in negative news plus declining on‑chain liquidity and increasing CEX open interest with high leverage is a very different risk profile from any one signal alone.
—
5. Real‑time streaming over nightly batches
Crypto trades 24/7, yet many legacy risk setups still crunch numbers once a day. That’s an obvious mismatch.
A modern blockchain risk monitoring software stack needs:
1. Ingestion pipelines for tick‑level market data and near‑real‑time on‑chain events
2. Stream processing to compute intraday metrics (rolling volatility, concentration, exposure per venue, gas spikes)
3. Lightweight models that can score risks incremental‑update style, not full retrain every minute
From a UX standpoint, this translates into dashboards that feel alive: updating every second or few seconds, with throttling or “calm mode” options so users aren’t overwhelmed.
—
Designing the actual screens: what users should see
6. Separate “cockpit view” from “lab view”
Short idea: one screen to steer, another screen to investigate.
– Cockpit view: Minimal, high‑signal. Current portfolio risk, aggregate exposures, top 3 active alerts, PnL impact under a couple of canonical stress scenarios.
– Lab view: Deep dives — factor attribution, backtests of strategies under historical shocks, explainable AI panels, stress test builders.
For example, the cockpit might just show “Total portfolio 1‑day ES: $12.3M (up 25% vs 7‑day avg)” plus a red banner: “Concentration risk: 61% exposure to correlated L2 tokens.” A single click takes a user into the lab where they can see correlation clusters, on‑chain liquidity distribution, and model explanations.
—
7. Human‑readable AI narratives
Numbers are great; short, clear stories are better.
Modern AI models (including smaller, specialized LLMs) can translate raw metrics into compact text that appears next to the charts:
– “Your BTC‑denominated collateral is now 78% of total margin. If BTC drops 8%, your projected margin utilization hits 112% on derivatives venues X and Y.”
– “Three of your counterparties have raised liquidation risk scores due to falling on‑chain balances and decreasing CEX deposits.”
If you’re building an AI powered crypto trading dashboard, these micro‑narratives help traders and risk managers stay synchronized. No one has to interpret a jungle of charts from scratch after a long shift.
—
8. Alert design: less noise, more context
Crypto risk dashboards fail not because they miss signals, but because they generate too many mediocre ones.
You want AI to help with:
1. Aggregation: Cluster related raw alerts into one “incident” (e.g., liquidity dried up + spread blew out + funding flipped) instead of three separate pings.
2. Prioritization: Score business impact — will this event realistically move portfolio PnL or only a tiny tail?
3. Suppression: Silence lower‑priority alerts when a high‑priority incident is already in progress to avoid alert storms.
Good UI pattern: show an incident card with a risk score, affected assets, time decay (how fast you must act), and a short action checklist.
—
Feature checklist: what to actually build in 2025
9. Must‑have modules for a serious platform
A modern crypto risk management dashboard in 2025 should realistically include:
1. Exposure map
– Per asset, per venue, per counterparty, and per chain.
– AI can detect hidden clusters (assets that move together during stress, even if they’re not obviously related).
2. Stress testing lab
– Pre‑built scenarios: 30% BTC dump, stablecoin de‑peg, exchange outage, L1 congestion.
– AI‑generated “plausible but unseen” scenarios based on similarity to historical stress events.
3. Liquidity and slippage monitor
– Order book depth, DEX liquidity, time‑to‑exit by position size.
– AI estimates “effective exit price” during rush conditions, not just calm periods.
4. Counterparty and protocol risk panel
– Centralized counterparties: balances, withdrawal delays, credit utilization, news risk.
– DeFi: TVL trends, code audit history, governance risks, exploit probability estimates.
5. Compliance and sanctions overlay
– Wallet clustering, transaction pattern analysis.
– AI surfaces suspicious flows and maps them to risk grades for compliance review.
These modules can sit inside a broader crypto portfolio risk management tools suite, or they can be exposed as APIs for firms to build their own custom front‑ends.
—
Stats, trends and where the market is headed
10. Where we are now (circa 2024–2025)
Public research and industry surveys leading into 2025 suggest a few clear patterns:
– A growing majority of institutional desks touching digital assets report having some form of dedicated crypto risk tooling — but many still rely on adapted FX/derivatives systems.
– On‑chain analytics vendors and exchanges increasingly provide risk‑oriented feeds (liquidation maps, whale flows, MEV risk indicators), hinting at robust demand for integrated dashboards.
– There’s a visible shift from pure PnL dashboards to holistic risk views: leverage, liquidity, counterparty, and regulatory risks in one place.
We don’t yet have perfectly harmonized global reporting, but directionally the message is obvious: unmanaged crypto risk is becoming a career‑limiting move for professionals.
—
11. Forecasts: what to design for, not just what to support today
Looking out over the rest of the decade, most credible forecasts align on a few themes:
Longer forecast paragraph:
– Institutionalization continues: More traditional asset managers, banks, and corporates will allocate a slice of portfolios to tokenized assets, not just Bitcoin and Ethereum. That pushes demand for dashboards that integrate crypto risk alongside bonds, equities, and commodities.
– Regulation tightens: Capital requirements, collateral eligibility rules, and reporting standards for digital assets will harden, particularly in large markets (EU, US, major Asian hubs). This means audit trails, model governance, and explainability move from “nice add‑ons” to legal requirements.
– Composability of risk tooling: Instead of one monolithic cryptocurrency risk analytics platform, expect ecosystems of specialized services (on‑chain risk scoring, derivatives risk models, compliance AI) stitched together via APIs into custom dashboards.
– Autonomous risk guardians: Some firms will let AI agents auto‑rebalance small portions of portfolios or auto‑tighten risk limits as volatility spikes, with humans supervising bigger decisions.
If you’re designing now, you want your architecture ready for more assets, more regulation, and more automation — without a full rewrite.
—
Economic aspects: why the business case is strong
12. Direct cost and revenue impact
Well‑designed dashboards do more than help people “feel safer”; they change economics.
– Reduced blow‑up risk: Avoiding even one major liquidation cascade or trapped capital on a failing exchange can pay back the entire investment in a risk platform.
– Cheaper capital: LPs and banks are more willing to provide leverage and credit when they see real‑time, professional risk monitoring, which can lower funding costs.
– Operational efficiency: If AI is doing the first pass on anomalies and routing them to the right person, you need fewer manual eyes to watch the same level of exposure.
For trading firms, being able to run fast but under control often means they can safely deploy more leverage or more strategies, increasing expected returns for the same risk budget.
—
13. Competitive and ecosystem effects
As better dashboards spread, the bar for “professional crypto operation” rises.
Firms that run advanced blockchain risk monitoring software gain:
– Stronger negotiation power with institutional clients and regulators
– Greater resilience during market shocks (less forced selling, fewer rushed withdrawals)
– Better internal decision‑making; PMs can experiment within guardrails instead of guessing their risk
On the flip side, platforms that skimp on risk tooling may find themselves shut out of institutional flows or forced to pay a premium for capital and insurance.
—
Impact on the wider crypto industry
14. From “YOLO” to risk‑aware infrastructure
As AI‑enabled risk dashboards mature, the cultural norms in crypto shift. Risk isn’t just a back‑office concern; it becomes part of everyday trading and building.
Shorter reflection:
– Protocol developers start shipping with built‑in circuit breakers and risk telemetry designed for dashboards.
– Exchanges expose richer APIs for margin and liquidation data because clients demand plug‑and‑play integration.
– DAOs create public, transparent risk dashboards for their treasuries, boosting trust and potentially lowering governance drama.
In other words, risk becomes visible — and once it’s visible, market participants can actually price it, hedge it, or walk away from it.
—
Practical design tips: how to get started
15. A pragmatic implementation roadmap
If you’re just starting to design an AI‑assisted crypto risk stack, a sensible sequence looks like this:
1. Clarify your risk policies and limits
Define what you care about: max leverage per strategy, max exposure per token, allowed counterparties, drawdown limits, regulatory constraints. No dashboard can fix a vague policy.
2. Map your data reality
Inventory what you can reliably access: CEX APIs, DEX subgraphs, on‑chain node data, news feeds. Fill gaps with third‑party providers before over‑promising AI magic.
3. Build the boring metrics first
Exposure, PnL, simple VaR, liquidity snapshots. If you can’t compute these cleanly, adding AI will only multiply confusion.
4. Layer in AI on specific pain points
Start where humans are overloaded: anomaly detection across dozens of venues, grouping noisy alerts, or generating scenario suggestions. Measure whether alerts become more precise and useful.
5. Iterate on UX with real users
Sit with traders, risk managers, and ops. Watch what they click, which views they bookmark, which alerts they mute. Let this feedback drive what your AI surfaces by default.
This roadmap keeps you grounded while still moving toward a future‑proof, AI‑native design.
—
Closing thoughts

Designing AI‑assisted dashboards for crypto risk in 2025 isn’t about adding a chatbox and calling it “intelligent.” It’s about stitching together solid risk math, rich data, explainable AI, and human‑centered UX into a tool that people can rely on when the market gets ugly.
If you manage to do that — whether by building a full‑stack solution or by composing best‑of‑breed services into a single view — your dashboard stops being just software. It becomes part of your firm’s risk culture and, ultimately, its edge.